
New – Use CloudWatch Synthetics to Monitor Sites, API Endpoints, Web Workflows, and More
 Today’s applications encompass hundreds or thousands of moving parts including containers, microservices, legacy internal services, and third-party services. In addition to monitoring the health and performance of each part, you need to make sure that the parts come together to deliver an acceptable customer experience.
CloudWatch Synthetics (announced at AWS re:Invent 2019) allows you to monitor your sites, API endpoints, web workflows, and more. You get an outside-in view with better visibility into performance and availability so that you can become aware of and then fix any issues quicker than ever before. You can increase customer satisfaction and be more confident that your application is meeting your performance goals.
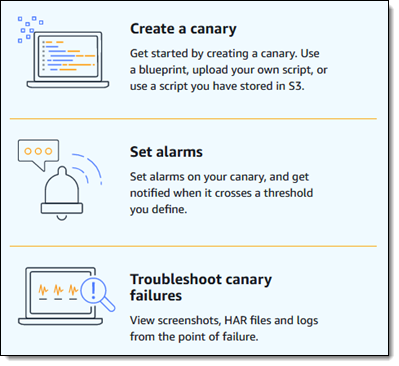
You can start using CloudWatch Synthetics in minutes. You simply create canaries that monitor individual web pages, multi-page web workflows such as wizards and checkouts, and API endpoints, with metrics stored in Amazon CloudWatch and other data (screen shots and HTML pages) stored in an S3 bucket. as you create your canaries, you can set CloudWatch alarms so that you are notified when thresholds based on performance, behavior, or site integrity are crossed. You can view screenshots, HAR (HTTP archive) files, and logs to learn more about the failure, with the goal of fixing it as quickly as possible.
CloudWatch Synthetics in Action
Canaries were once used to provide an early warning that deadly gases were present in a coal mine. The canaries provided by CloudWatch Synthetics provide a similar early warning, and are considerably more humane. I open the CloudWatch Console and click Canaries to get started:
I can see the overall status of my canaries at a glance:
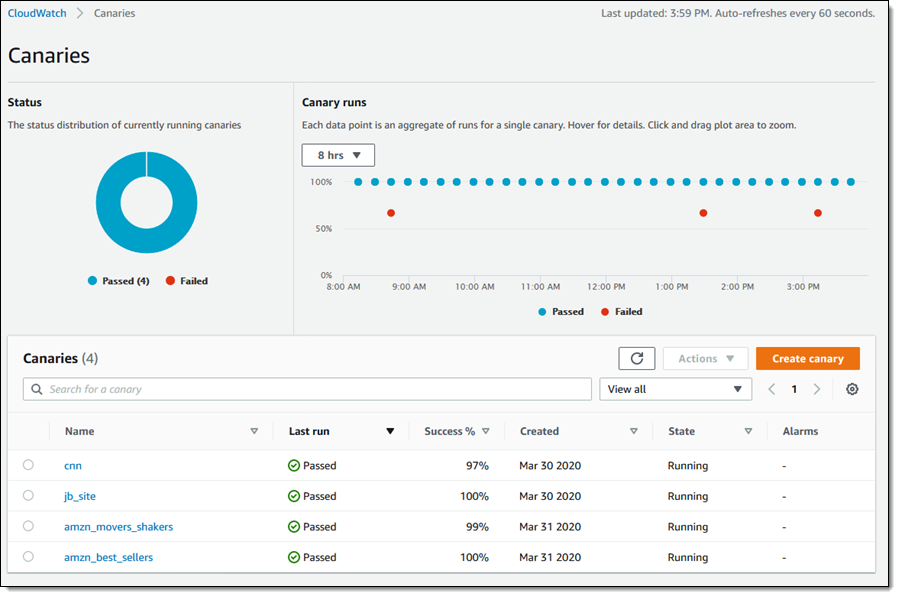
I created several canaries last month in preparation for this blog post. I chose a couple of sites including the CNN home page, my personal blog, the Amazon Movers and Shakers page, and the Amazon Best Sellers page. I did not know which sites would return the most interesting results, and I certainly don’t mean to pick on any one of them. I do think that it is important to show you how this (and every) feature performs with real data, so here we go!
I can turn my attention to the Canary runs section, and look at individual data points. Each data point is an aggregation of runs for a single canary:
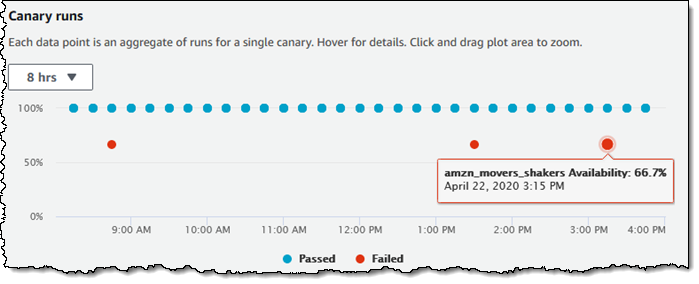
I can click on the amzn_movers_shakers canary to learn more:
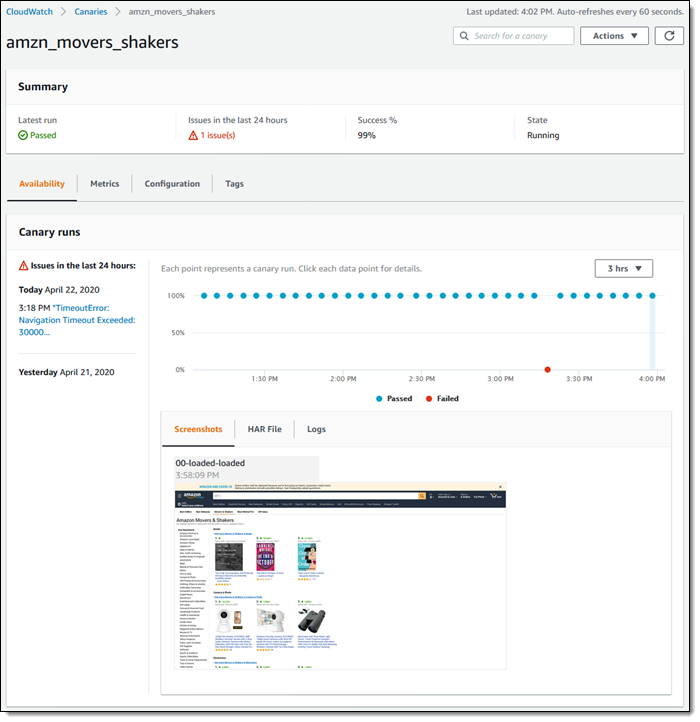
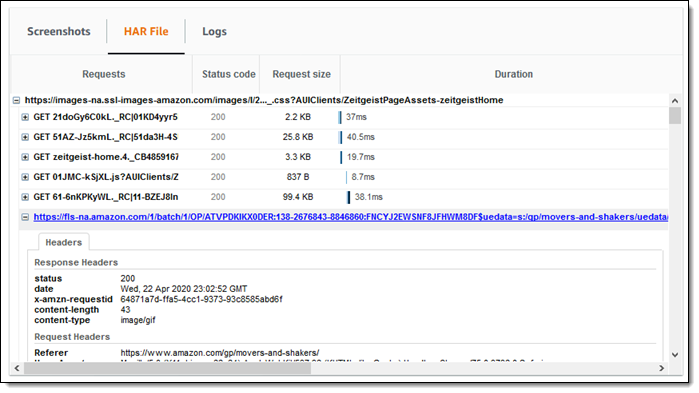
I can see that there was a single TimeoutError issue in the last 24 hours. I can see the screenshots that were captured as part of each run, along with the HAR files and logs. Each HAR file contains a detailed log of the HTTP requests that were made when the canary was run, along with the responses and the amount of time that it took for the request to complete:
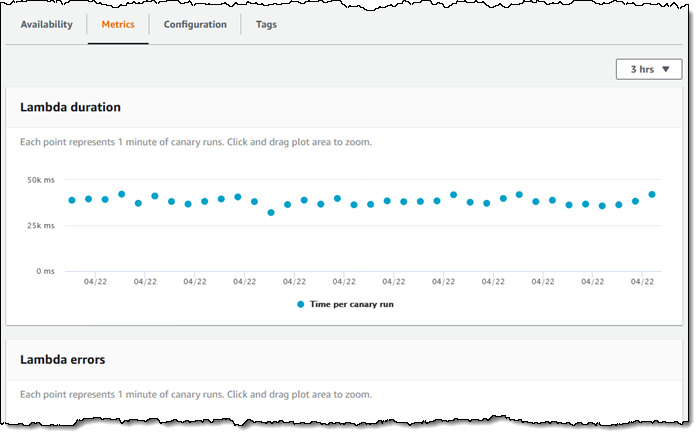
Each canary run is implemented using a Lambda function. I can access the function’s execution metrics in the Metrics tab:
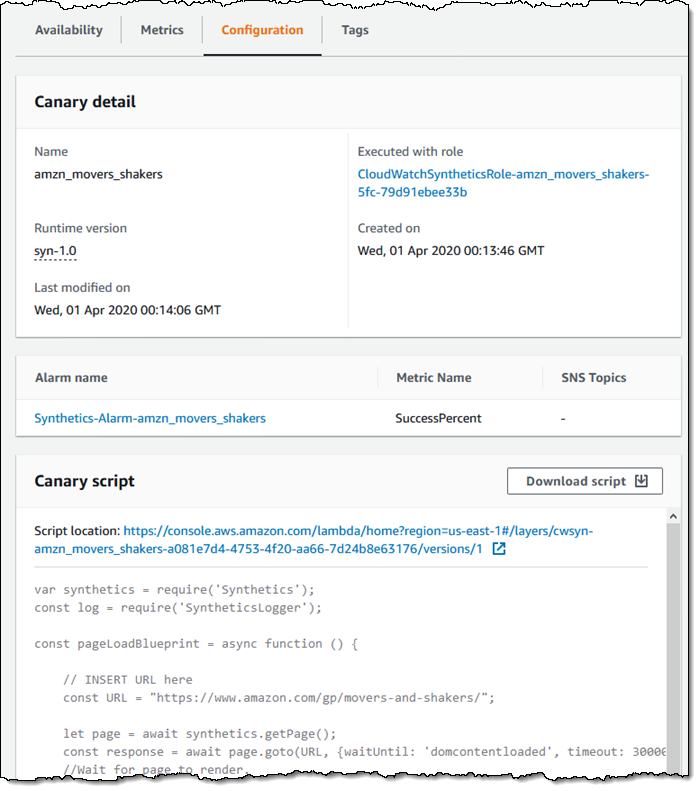
And I can see the canary script and other details in the Configuration tab:
Hatching a Canary
Now that you have seen a canary in action, let me show you how to create one. I return to the list of canaries and click Create canary. I can use one of four blueprints to create my canary, or I can upload or import an existing one:
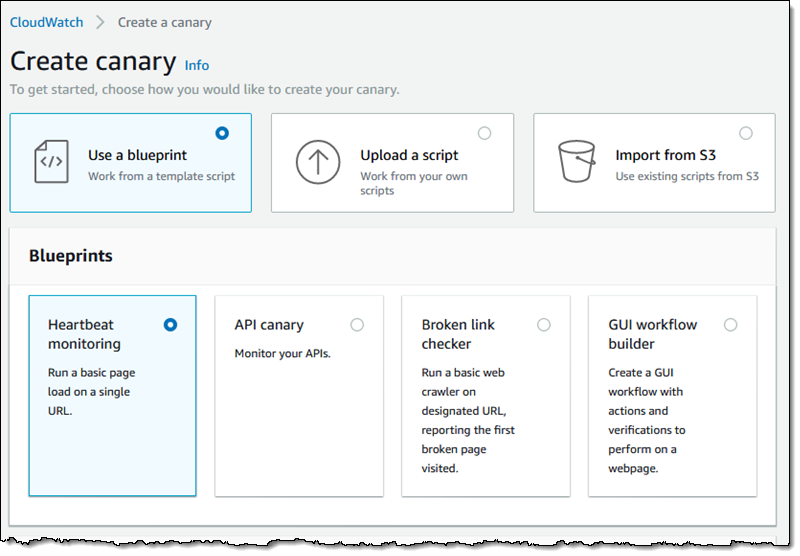
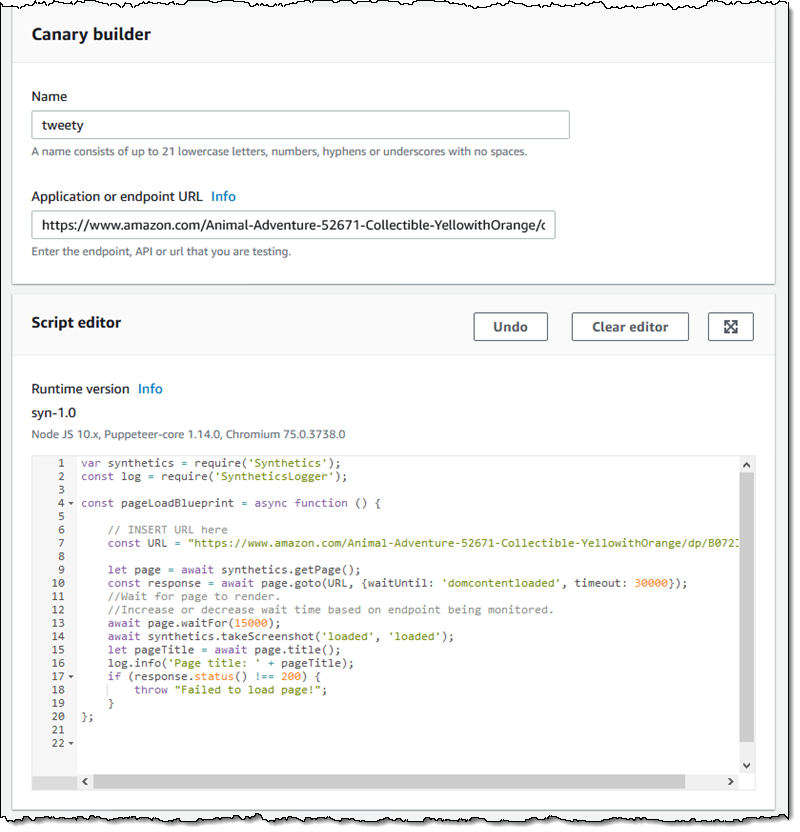
All of these methods ultimately result in a script that is run either once or periodically. The canaries that I showed above were all built from the Heartbeat monitoring blueprint, like this:
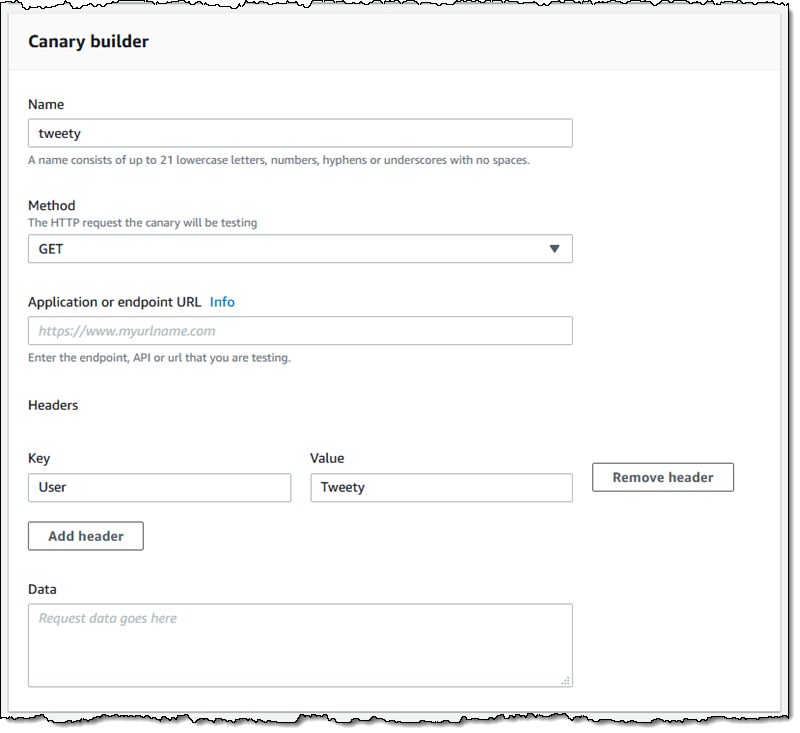
I can also create canaries for API endpoints, using either GET or PUT methods, any desired HTTP headers, and some request data:
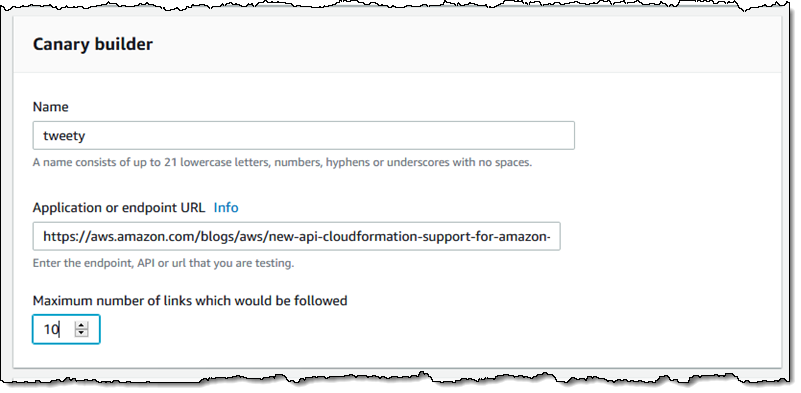
Another blueprint lets me create a canary that checks a web page for broken links (I’ll use this post):
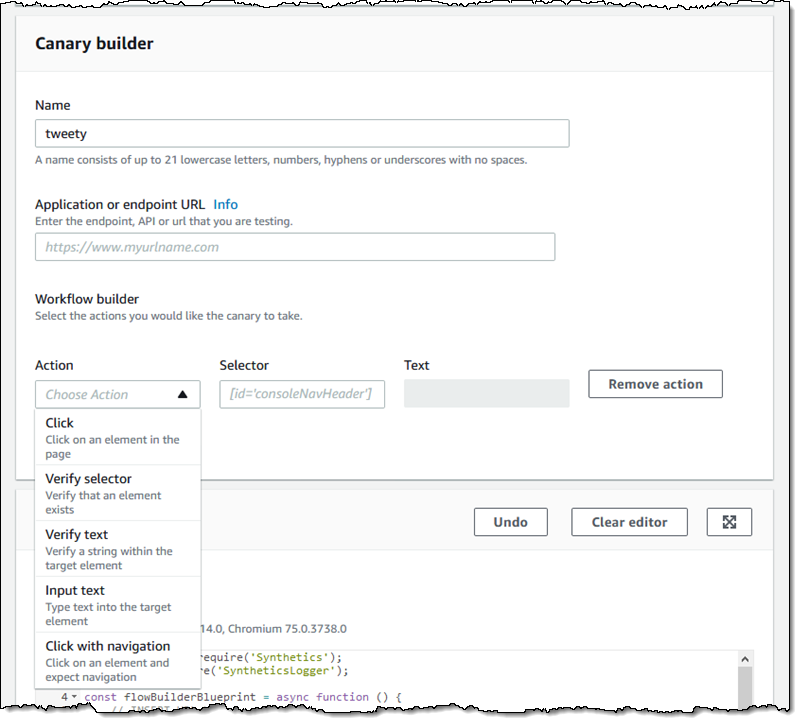
Finally, the GUI workflow builder lets me create a sophisticated canary that can include simulated clicks, content verification via CSS selector or text, text entry, and navigation to other URLs:
As you can see from these examples, the canary scripts are using the syn-1.0 runtime. This runtime supports Node.JS scripts that can use the Puppeteer and Chromium packages. Scripts can make use of a set of library functions and can (with the right IAM permissions) access other AWS services and resources. Here’s an example script that calls AWS Secrets Manager:
var synthetics = require('Synthetics');
const log = require('SyntheticsLogger');

const AWS = require('aws-sdk');
const secretsManager = new AWS.SecretsManager();

const getSecrets = async (secretName) => {
    var params = {
        SecretId: secretName
    };
    return await secretsManager.getSecretValue(params).promise();
}

const secretsExample = async function () {
    // Fetch secrets
    var secrets = await getSecrets("secretname")

    // Use secrets
    log.info("SECRETS: " + JSON.stringify(secrets));
};

exports.handler = async () => {
    return await secretsExample();
};
Scripts signal success by running to completion, and errors by raising an exception.
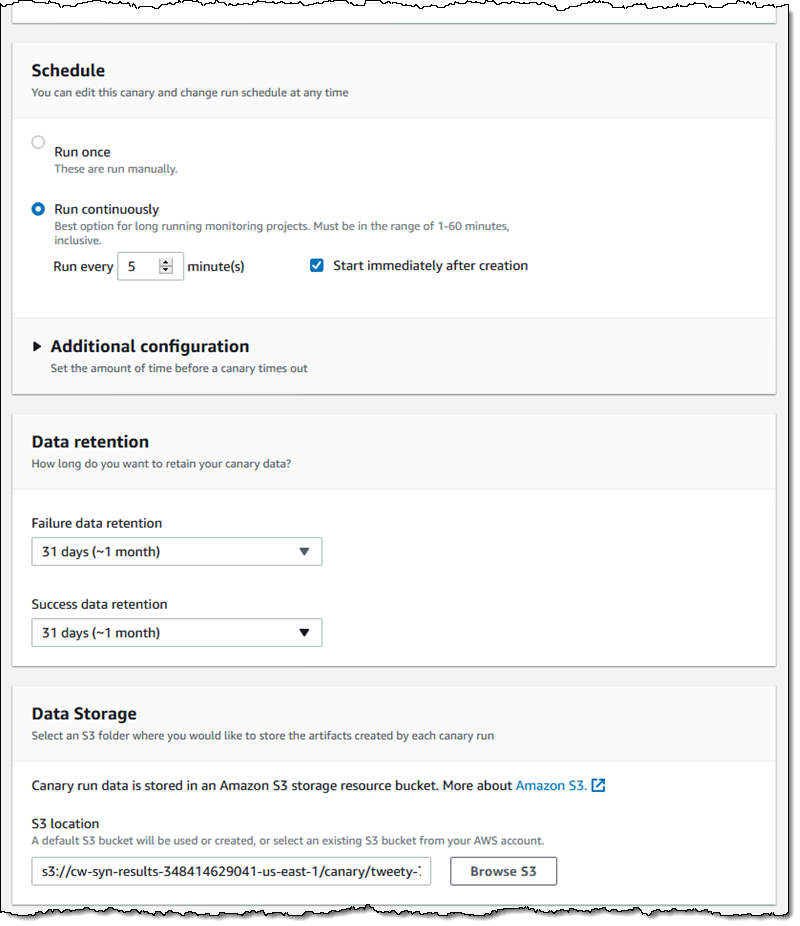
After I create my script, I establish a schedule and a pair of data retention periods. I also choose an S3 bucket that will store the artifacts created each time a canary is run:
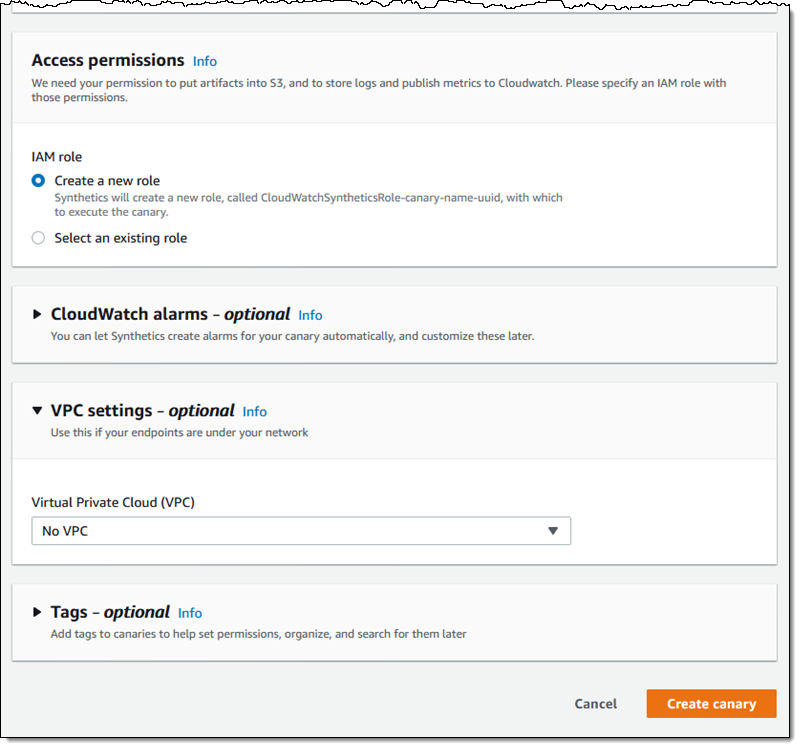
I can also control the IAM role, set CloudWatch Alarms, and configure access to endpoints that are in a VPC:
Watch the demo video to see CloudWatch Synthetics in action:
Things to Know
Here are a couple of things to know about CloudWatch Synthetics:
Observability – You can use CloudWatch Synthetics in conjunction with ServiceLens and AWS X-Ray to map issues back to the proper part of your application. To learn more about how to do this, read Debugging with Amazon CloudWatch Synthetics and AWS X-Ray and Using ServiceLens to Monitor the Health of Your Applications.
Automation – You can create canaries using the Console, CLI, APIs, and from CloudFormation templates.
Pricing – As part of the AWS Free Tier you get 100 canary runs per month at no charge. After that, you pay per run, with prices starting at $0.0012 per run, plus the usual charges for S3 storage and Lambda invocations.
Limits – You can create up to 100 canaries per account in the US East (N. Virginia), Europe (Ireland), US West (Oregon), US East (Ohio), and Asia Pacific (Tokyo) Regions, and up to 20 per account in other regions where CloudWatch Synthetics are available.
Available Now
CloudWatch Synthetics are available now and you can start using them today!
— Jeff;


from AWS News Blog https://ift.tt/2S2i4LY
via IFTTT
Comments
Post a Comment